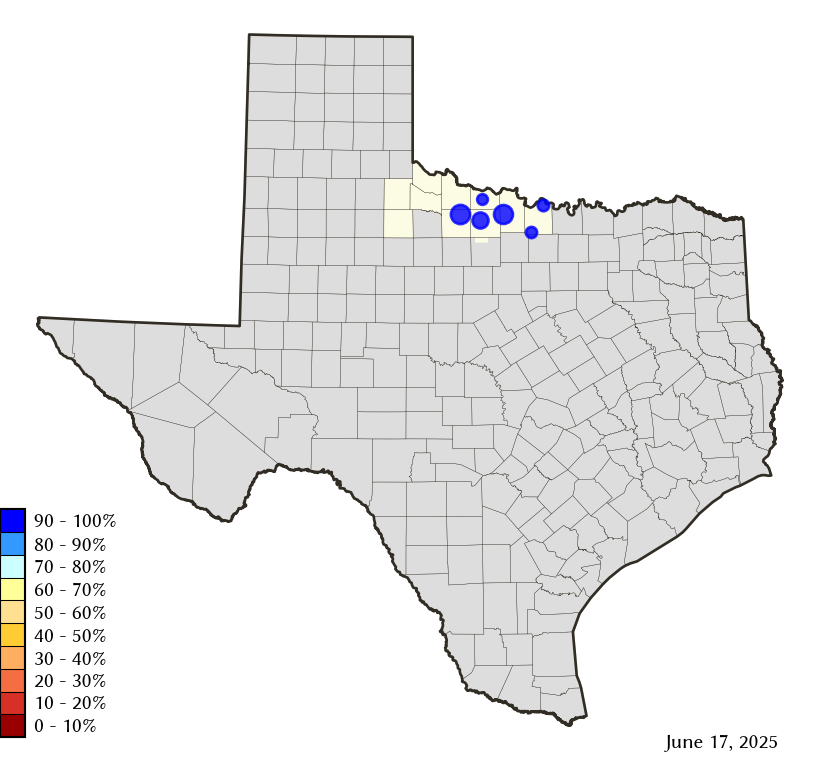
Region-B Planning Region Reservoirs: Monitored Water Supply Reservoirs are 100.0% full on 2025-06-16


Historical Data
| Date | Percent Full |
Reservoir Storage (acre-ft) |
Conservation Storage (acre-ft) |
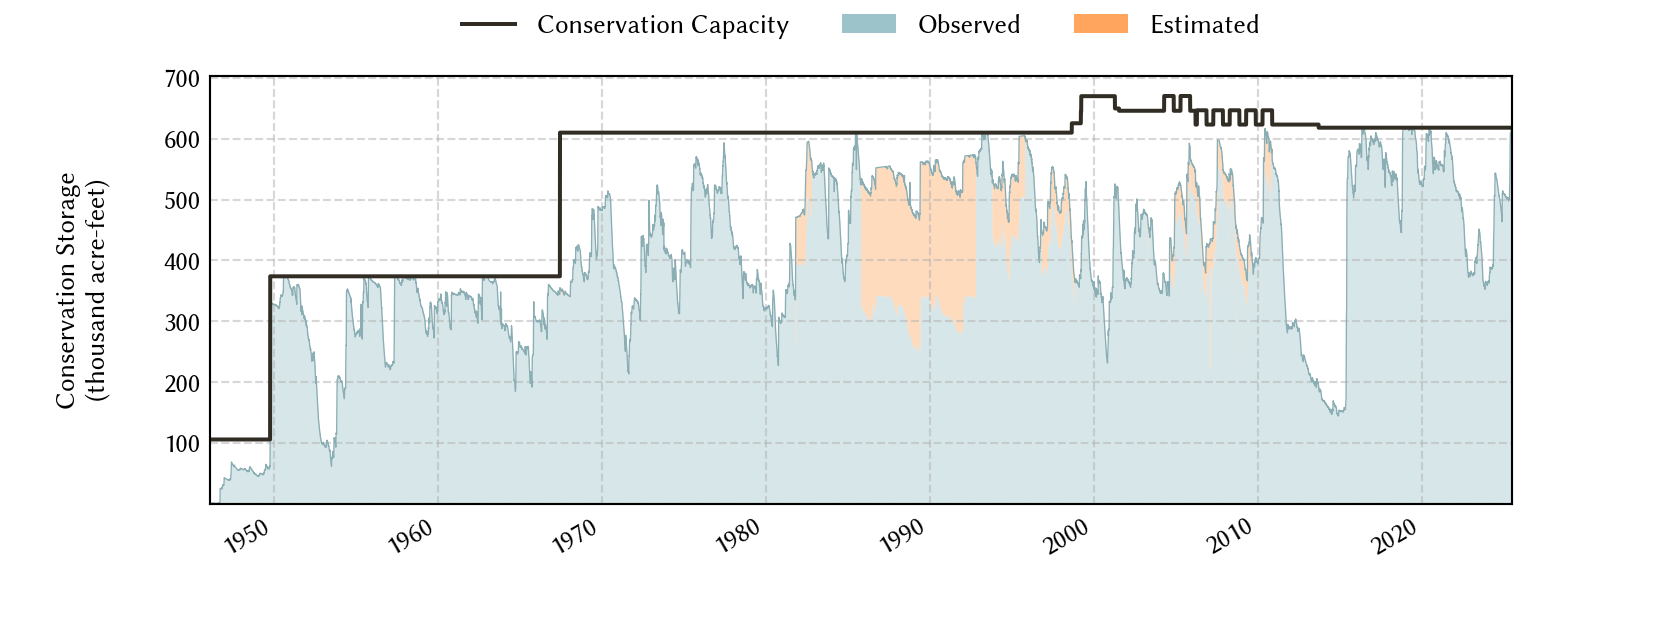
Conservation Capacity (acre-ft) |
|
|---|---|---|---|---|---|
| Today | 2025-06-16 | 100.0 | 680,955 | 618,121 | 618,121 |
| Yesterday | 2025-06-15 | 100.0 | 680,955 | 618,121 | 618,121 |
| 2 days ago | 2025-06-14 | 100.0 | 679,731 | 617,977 | 618,121 |
| 1 week ago | 2025-06-09 | 100.0 | 675,058 | 618,121 | 618,121 |
| 1 month ago | 2025-05-16 | 98.5 | 689,512 | 608,626 | 618,121 |
| 3 months ago | 2025-03-16 | 81.2 | 509,298 | 502,022 | 618,121 |
| 6 months ago | 2024-12-16 | 82.5 | 520,517 | 509,838 | 618,121 |
| 1 year ago | 2024-06-16 | 87.9 | 622,015 | 543,120 | 618,121 |
*
Percent Full is based on Conservation Storage and Conservation Capacity and doesn't account for storage in flood pool.
Area Map
Reservoir Storage
| Reservoir | Type | Percent Full |
Water Level (ft) |
Height Above Conservation Pool (ft) |
Reservoir Storage (acre-ft) |
Conservation Storage (acre-ft) |
Conservation Capacity (acre-ft) |
Surface Area (acres) |
|---|---|---|---|---|---|---|---|---|
| Amon G Carter |

|
100.0 | 921.69 | 1.69 | 22,800 | 19,266 | 19,266 | 1,606 |
| Arrowhead |
|
100.0 | 926.02 | 0.02 | 230,650 | 230,359 | 230,359 | - n.a. - |
| Kemp |

|
100.0 | 1,147.39 | 3.39 | 300,117 | 245,307 | 245,307 | - n.a. - |
| Kickapoo |
|
100.0 | 1,045.38 | 0.38 | 88,589 | 86,345 | 86,345 | - n.a. - |
| Nocona |
|
100.0 | 828.38 | 0.88 | 22,943 | 21,444 | 21,444 | - n.a. - |
| North Fork Buffalo Creek |
|
100.0 | 1,048.22 | 0.22 | 15,856 | 15,400 | 15,400 | 1,533 |